Introduction
The purpose of this module is to show you how to track position data using a low-cost camera such as a smartphone. Use this video to follow along!
External Resources
Procedure
Set up your Experiment
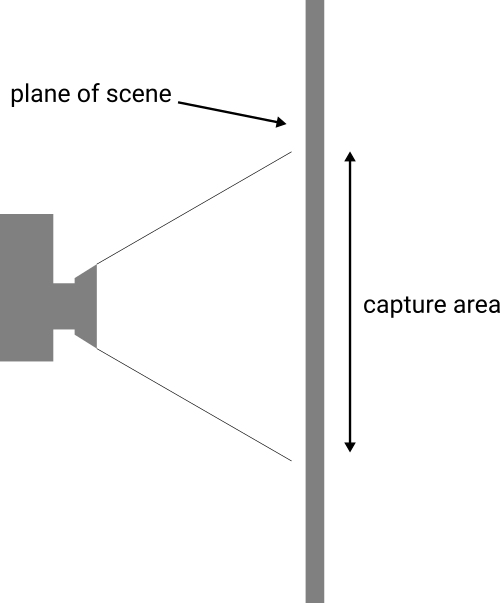
Create your experiment so that captured motion is in a plane perpendicular to the lens’s radial axis.
Ensure markers are not occluded as your system moves. This will result in lost data.
Ensure your “ground link” is rigidly attached to ground. Any unmeasured flexibility will add error to your system
Eliminate the effects of contact and friction if possible. Rigidly attach your system in a given configuration rather than assuming it is unmoving due to friction.
Place Markers.
- Utilize a high-contrast color scheme in the materials you use. If your device is dark or light-colored, create colored markers that are the inverse color scheme.
- Add markers to your (fixed) base reference frame. This will be useful in case your camera moves during capture.
- When sizing your markers, consider that the larger your marker, the larger the search window needs to be in tracker, which will slow tracking down. The smaller your marker, the higher
Light your Experiment
- Light your scene well so that your camera may use a smaller aperture. This will help reduce blurring and improve tracking performance.
- Avoid shadows, changing lighting conditions, or other dark/light spots in your scene. Sunlight is good as long as it does not go behind a cloud.
Measure your experiment. Take key measurements of your system, including:
- Distance between each marker
- Mass of rigid links
- Distance between camera lens and plane of experiment. (useful for expert-level calibration)
Take video. Suggestions:
- If possible to manually adjust camera settings, increase shutter rate
- Set your shutter speed to at least 1/500th of a second or faster.
- Use a lens that has a long focus length so that you can reach the action (200mm or higher)
- Use “slow motion” mode if available. This will increase the frame-rate.
- Set the camera far enough back that it captures the whole scene as your device moves throughout its workspace. Utilize the center of the frame as much as possible to minimize lens distortion effects
- Measure the angle of “ground” by including
- Use a tripod to ensure your camera does not move.
- If possible to manually adjust camera settings, increase shutter rate
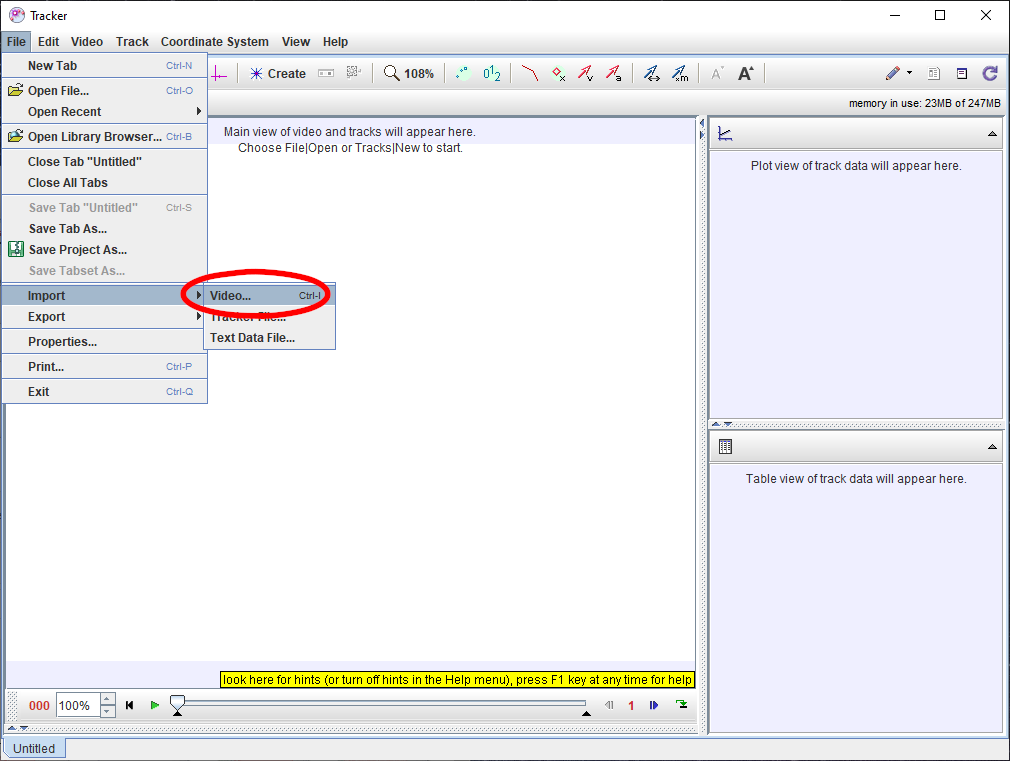
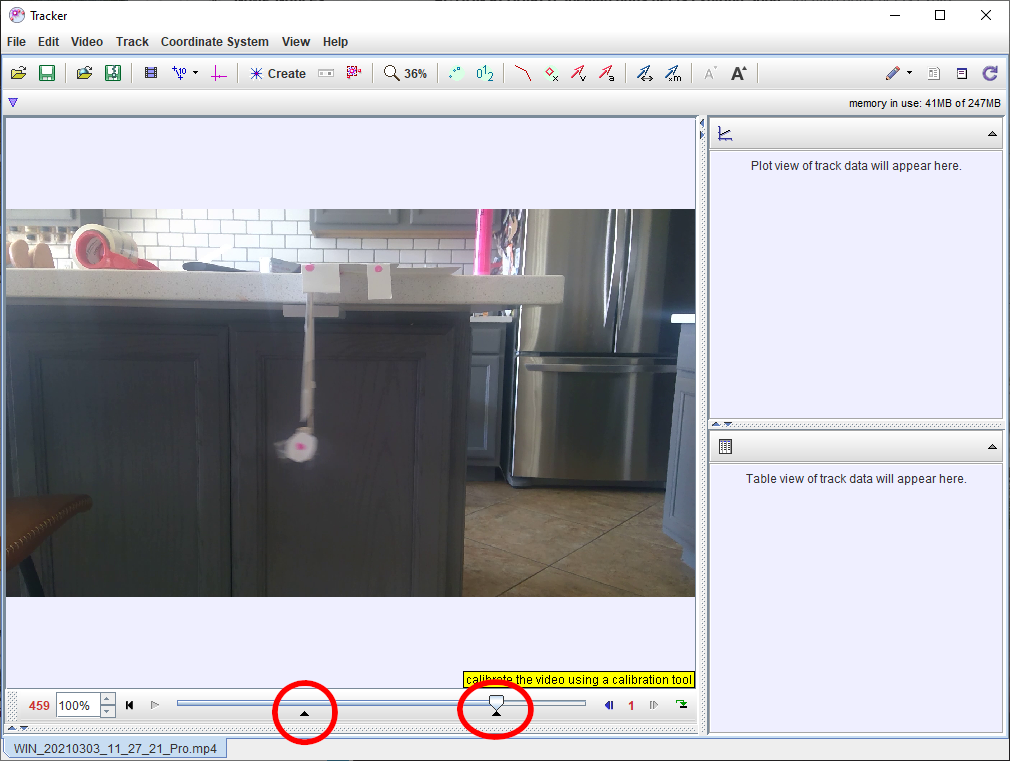
Open Tracker, then load a new video.
- Adjust the markers on the left and right of the timeline to select a portion of the video
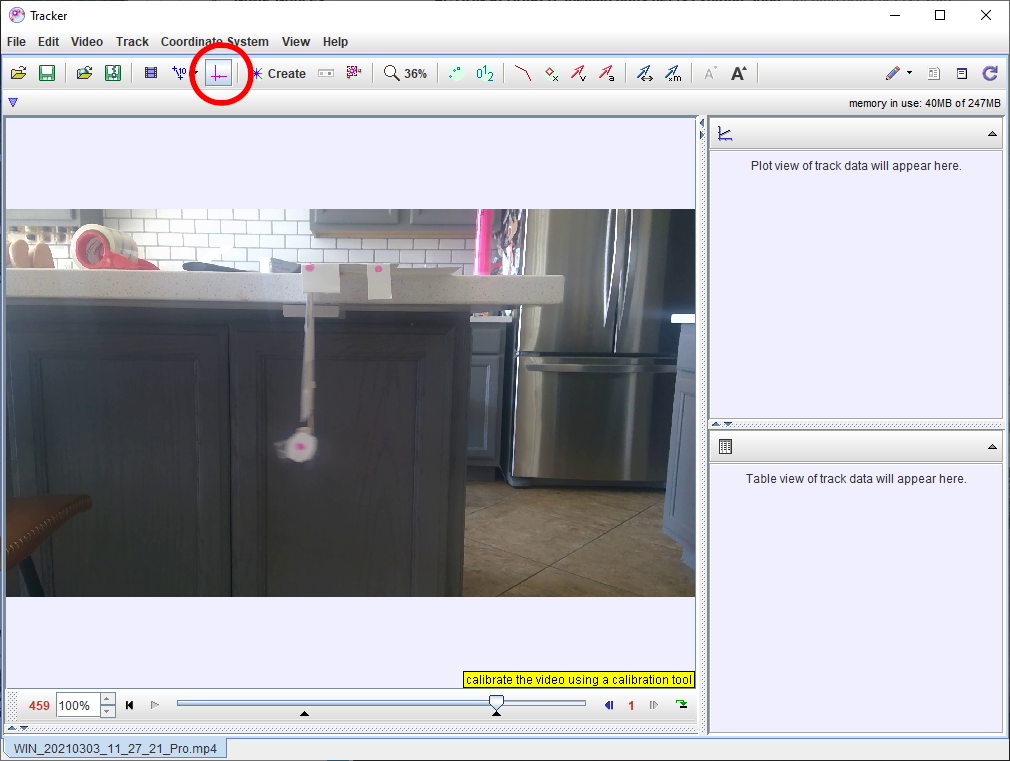
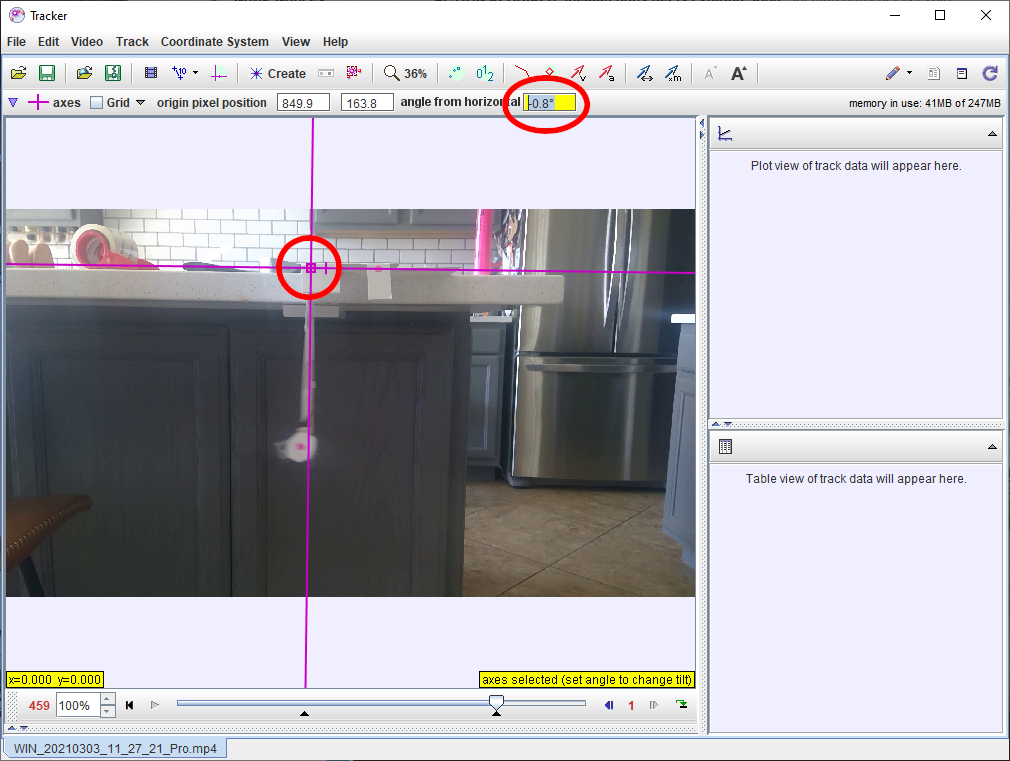
Create a “coordinate system”. Drag the marker to the origin of your system and align the x axis with the horizontal plane using the angle box
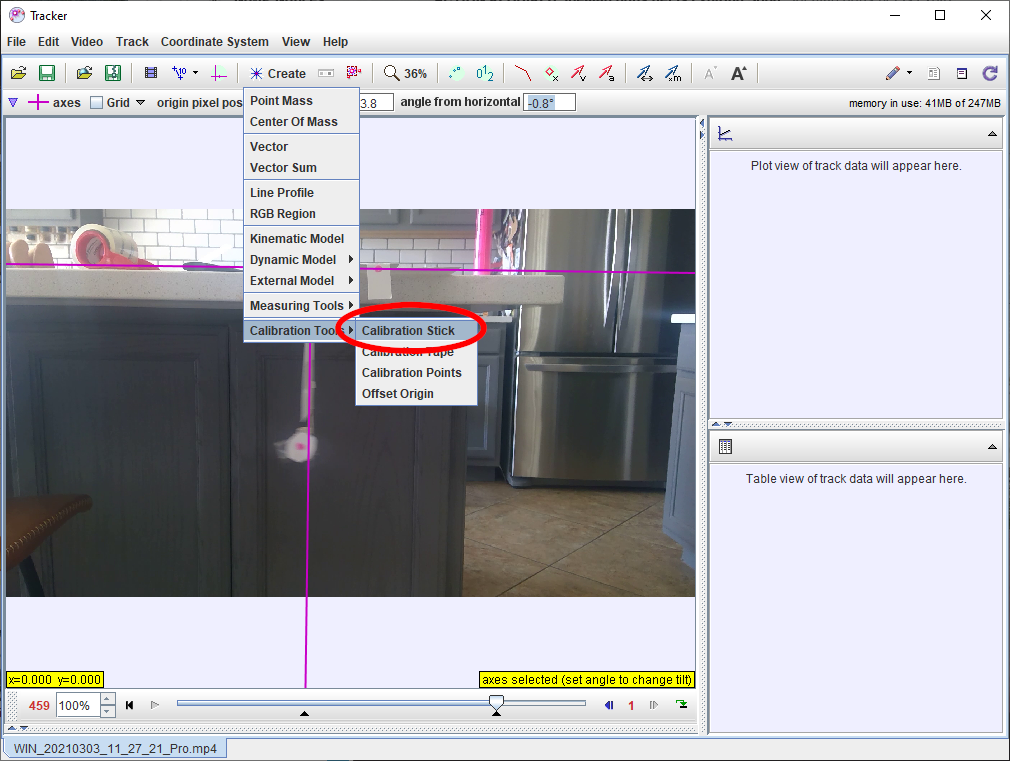
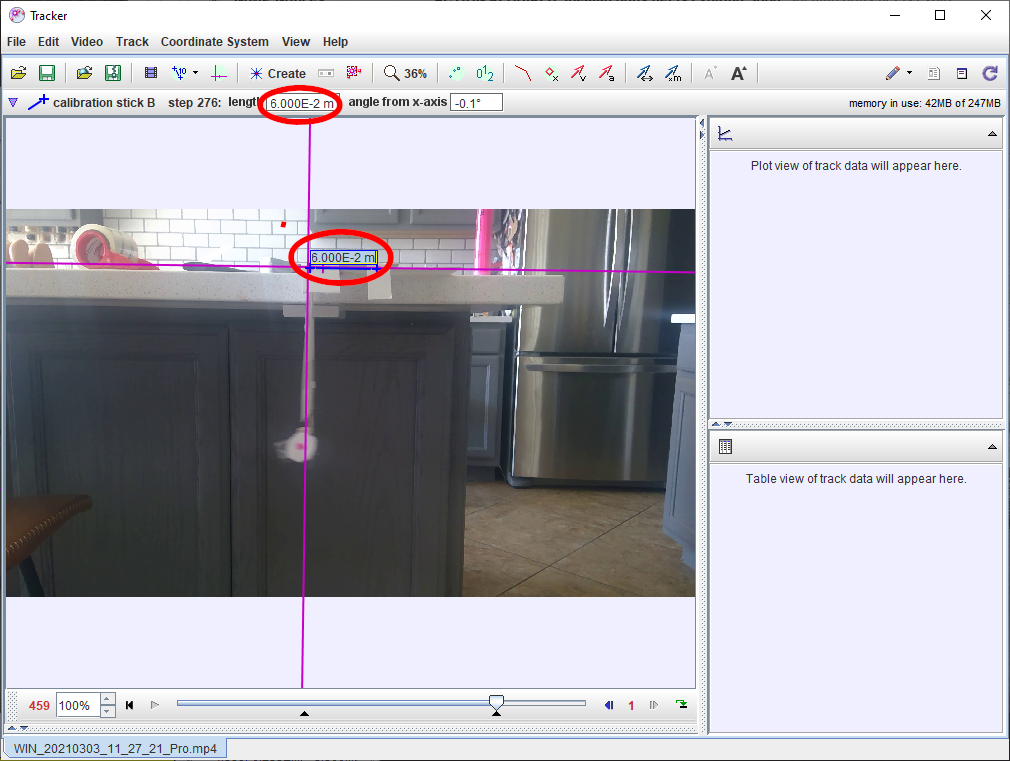
Create a Calibration Stick. Use shift+left click to place two points, then enter the length measured between those points
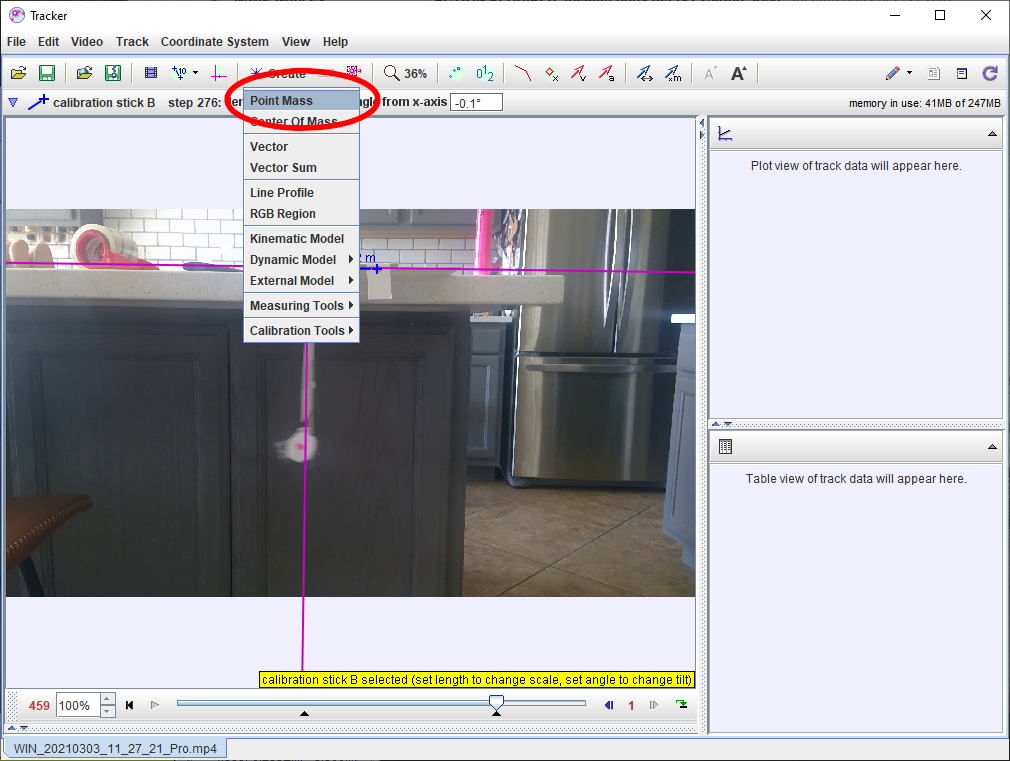
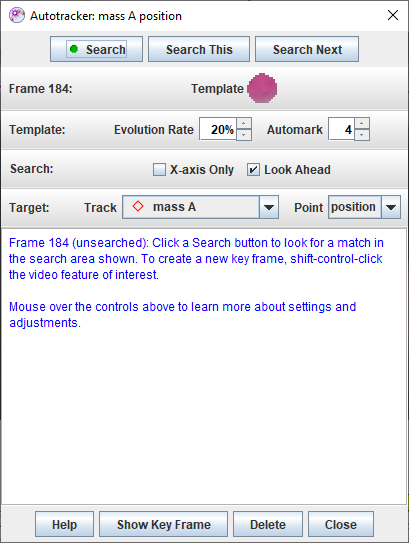
Track points.
- Create a new point mass
- Using ctrl+shift+left click, select an identifiable object in the scene to create a keyframe
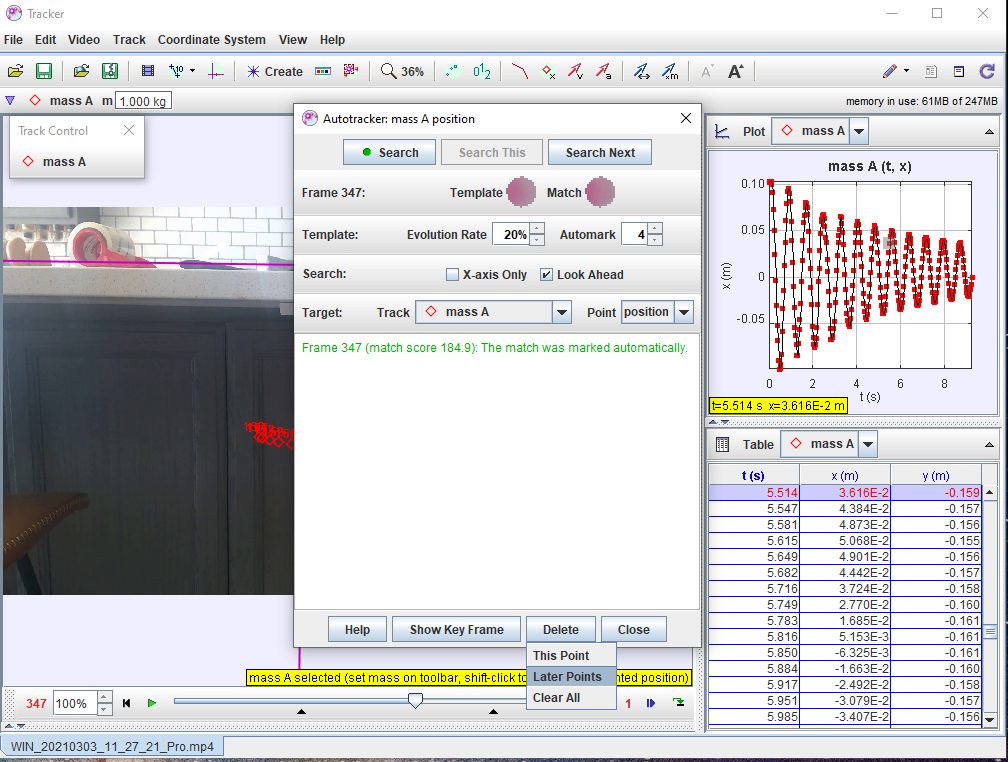
- Click Search and Tracker will automatically track the template as far as it can. You can also adjust the size of the search box to increase the chances of it being found automatically
If problems occur, you can re-select points or fix keyframes using the tools in the autotracker window.
- If the tracker loses the location of the mass, you can reselect it using ctrl + shift + left select.
- If the tracking is in error, you can go back in your video to the point it diverged and delete all keyframes after.
Repeat if you have multiple markers to track. Close the window when done
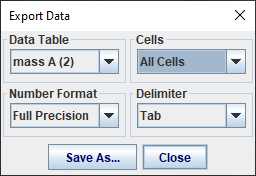
Export data table to a .csv file. Note: it seems that tracker’s export function is a little buggy. Instead of exporting a file directly, set your settings per the figure below and copy all rows and columns of the data table below directly into excel.
check that the full precision of the numbers was retrieved by adjusting the format.
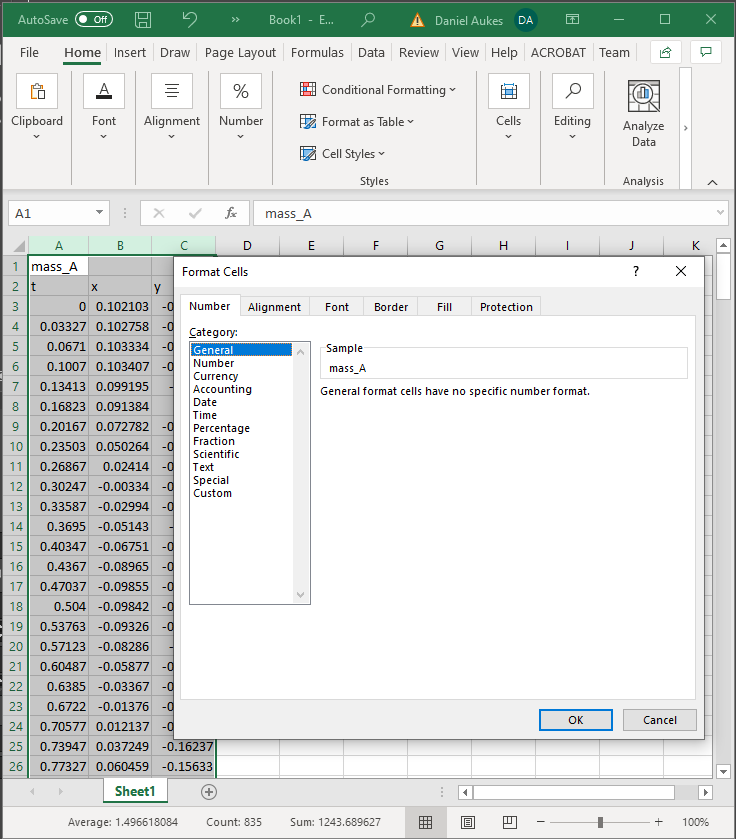
save as .csv
Use the following code to extract your data and interpolate it:
# -*- coding: utf-8 -*-
"""
Created on Wed Mar  3 13:54:15 2021

@author: danaukes
"""

import pandas as pd
import numpy
import matplotlib.pyplot as plt
import scipy.interpolate as si

df=pd.read_csv(r'C:\Users\danaukes\Documents\Tracker\mydata.csv', sep=',')

#x = df.x.astype('float64').to_numpy()
x = df.x.to_numpy()
y = df.y.to_numpy()
t = df.t.to_numpy()


xy = numpy.array([x,y]).T
f = si.interp1d(t,xy.T,fill_value='extrapolate',kind='quadratic')
new_t = numpy.r_[0:t[-1]:.1]

plt.figure()
plt.plot(t,x)
plt.plot(new_t,f(new_t)[0])

plt.figure()
plt.plot(t,y)
plt.plot(new_t,f(new_t)[1])
plt.figure()
plt.plot(x,y)